China Stimulus Measures Help Soften Economic Slowdown
June 01 2016 - 12:10AM
Dow Jones News
BEIJING—An official measure of China's manufacturing sector held
steady in May while a private gauge edged down slightly, as
aggressive monetary stimulus in the first quarter cushioned the
downdraft in the world's second-largest economy.
The National Bureau of Statistics said Wednesday that China's
official purchasing managers index for manufacturing remained at
50.1 last month, the same level as in April and the third
consecutive month the index kept above 50, the line separating
expansion from contraction. The May PMI beat a median forecast of
49.9 by 11 economists polled by The Wall Street Journal.
The competing private Caixin manufacturing PMI edged down to
49.2 in May from 49.4 in April, the 15th straight month that index
has remained in contractionary territory, Caixin Media Co. and
research firm Markit said Wednesday. Caixin's index better reflects
the outlook for smaller private manufacturers while the official
PMI gives more weight to larger state-owned companies, economists
say.
China's official nonmanufacturing PMI, also released Wednesday,
fell to 53.1 from 53.5 in April.
Economists said the latest data suggest that Beijing's
frontloading of monetary and fiscal stimulus early this year should
make it easier for China to reach its 2016 growth target of at
least 6.5% this year.
"Growth has stabilized and policy will remain accommodative,"
said Standard Chartered Bank Ltd. economist Ding Shuang. "So 6.5%
is still a very serious target for the government. What people
should be worried about is the cost of maintaining that
growth."
One cost in particular, economists said, is rising debt as
Beijing expands credit faster than the rate of growth to bolster
economic stability. Banks lent a record 4.67 trillion yuan ($709
billion) in the first quarter, exceeding the amount released at the
depth of the global financial crisis even as growth decelerated in
the first quarter to 6.7%, its slowest pace since 2009.
"There are a lot of zombie companies and zombie loans," said
J.P. Morgan Chase & Co. economist Zhu Haibin, referring to
loss-making entities that are kept afloat. "If they don't write
that debt off, they stay on the balance sheet."
China's total debt, led by corporate liability, has increased to
260% of gross domestic product in 2015 from 160% in 2007,
economists estimate. Interest on China's mounting corporate debt
will take up around 60% of industrial profits for Chinese companies
this year, according to estimates by investment bank North Square
Blue Oak.
Wednesday's data come as China's industrial sector faces
continued headwinds as electricity and cement production weakens.
The statistics bureau said the manufacturing subindex measuring new
orders dropped to 50.7 in May from 51.0 in April, exports held
steady at 50.0 while the production subindex improved slightly to
52.3 from 52.2.
Xinxing Wood Processing Factory., a furniture maker based in Cao
County in eastern China's Shandong province, said it had 200 orders
last month compared with 500 orders a year earlier. "In the next
several months, I don't think things will improve much," said Meng
Fanxin, the company's general manager. "The domestic market is very
competitive."
Labor costs for the company have increased to over 65 yuan a
day, a 10% rise from recent levels, squeezing its profit margin to
10% from 15%, Mr. Meng said. As a result, the company may have to
lay off some of its 40 employees. "We are planning on buying more
advanced equipment so we won't need as many workers," he said. "A
job that used to take three workers can be done by one worker in
the same amount of time."
Economists said a stabilizing economy could give the government
some breathing room to take more aggressive structural reform,
including cuts in excess capacity and fostering new sources of
growth. China has pledged to reduce capacity in the steel and coal
sectors by around 10% in the next few years and cut a combined 1.8
million jobs, although industry analysts say this is far less than
what is needed to address the excess capacity in these
industries.
Liyan Qi contributed to this article.
Write to Mark Magnier at mark.magnier@wsj.com
(END) Dow Jones Newswires
May 31, 2016 23:55 ET (03:55 GMT)
Copyright (c) 2016 Dow Jones & Company, Inc.
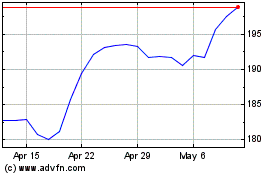
JP Morgan Chase (NYSE:JPM)
Historical Stock Chart
From Mar 2024 to Apr 2024

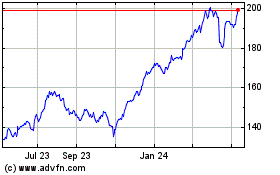
JP Morgan Chase (NYSE:JPM)
Historical Stock Chart
From Apr 2023 to Apr 2024
